
The past several years have proved that the retail arena is packed with intense competition, and like it’s neighbouring products, the retail movement of consumer electronics is subject to constant shifts in consumer behavior and changing trends, as demand and preferences move with the economic climate and innovation in that field. That being said, 2020 provides a unique standpoint to observe such trends, as current events in the United States deal a challenging hand to many subdivisions within the consumer electronics industry.
In This Content
The laptop market is still alive thanks to business, gaming, and most recently, WFH
Due to a relative lack of eye-opening innovation and the proliferation of alternative devices in America, laptops are seeing their demand dwindle by the year. This year in particular, retail analytic firm Stackline found that in May, during the thick of the pandemic, traffic to laptop product pages grew, while conversion rates plummeted from 3% to 1.5%. Furthermore, it should come as no surprise that tablets are eating into laptops’ and (even more so) desktops’ market revenue as they continue to populate the proverbial sea. Subsequently, laptop shipments are decreasing and the average selling price is falling accordingly.
That being said, the laptop market is still very much afloat, largely due to the needs of businesses, the work from home scenario, online classes, and gaming sectors. Their reputation for reliability in that context is strengthened by a speedy average stock replenishment time of 27 days, versus 114 days for tablets. That said, tablets do have a higher stocking freshness rate (a statistic that indicates the percentage of products newly added within a selected time range) at 34% compared to laptops’ 27%. This year, however, both stock replenishment rates have been heavily impacted worldwide- and this lack of stock has been cited as a reason for drops in conversion rates.
Factors such as prompt post sales support, professional marketing approaches, and (quite notably) competitive pricing have helped HP, Lenovo, and Dell rank as the top three sellers both in the U.S. and globally, with HP enjoying a sizable market share of 22.6% across the world. Lenovo thrives in portable laptop series and reliable customer support systems, and is rewarded with a 25.1% market share- Dell following closely behind with almost 17%.
Of all retailers in America that stock these laptops, Walmart boasts 13 times as many brands as its closest competitor! According to our own latest findings, 330 distinct brands are stocked at Walmart while second-in-line Target only offers in the range of 25.
Additionally, our product life cycle analysis shows that the best time to catch a discount for laptops in the USA is around the holiday season in December. That’s in contrast with mobile devices, which benefit from the largest average price cuts early in the year.
Of all consumer electronics, mobile devices have the highest category freshness
Regardless of when you purchase your phone, our data suggests that mobile devices have the highest category freshness. In fact, over 76,000 products have been stocked in the mobile category over the past 3 months as compared to 31,000+ in laptops and related accessories.
The Intelligence Node Product Lifecycle Dashboard actually calculates this for all sorts of products across retailers and industries. It can even determine how long an average fresh product maintains its initial discount, which in the mobile category is a brief 5.15 days.
Smartphone shipments in the USA reached 161 million in 2019, with the total number of smartphone users in the States crossing 260 million as of April 2020. The market leaders of this sector in 2020 are Apple (with a market share of 58.17), followed by Samsung (25.59%), both of which are titans in the consumer electronics industry with their respective operating systems (iOS and Android) found on nearly all U.S. smartphones. Tablets and e-readers are also experiencing healthy upward market trajectories.
Further, as an interesting note, studies show that the smartphone boom may have resulted in camera sales facing a massive categorical markdown- with digital camera sales dropping by 87% since 2010.
Given the current global climate in 2020, the change in consumer behavior and sentiments impacted the consumer electronics industry significantly, and dealt a blow to the global smartphone market- resulting in price cuts and drops in demand, which in China recovered in a quick surge as cases began to decrease- this trend is likely to follow suit globally, as cases decline.
Home entertainment provides the highest average discounts
That’s specifically in regards to home entertainment systems, which command over $4 billion in revenue with projected growth up to $5.5 billion over the next five years. And though these numbers are global, the majority of worldwide revenue lies in the States, where product prices range from several hundred USD to the tens of thousands (meaning those high discounts can be a serious boon).
“Home entertainment” can admittedly be a fairly ambiguous umbrella term. For more specificity: Both home audio systems and theater systems are witnessing a rise in sales.
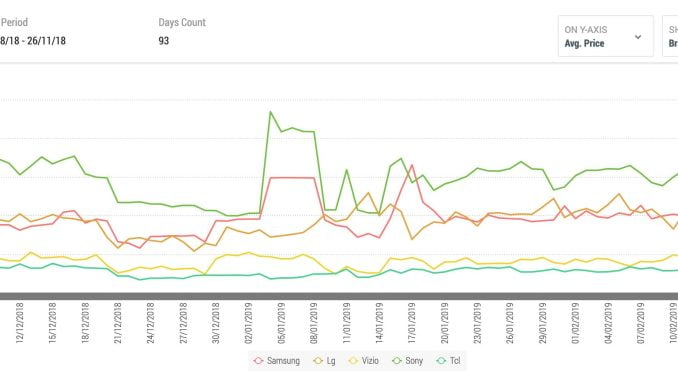
As for actual televisions themselves, Intelligence Node data has found that over 300 distinct TV brands are available in the U.S. market, with offering discounts on 4K televisions averaging three times more than those on HD products. Samsung sits comfortably atop that leaderboard, followed by Sony, LG, and then VIZIO.
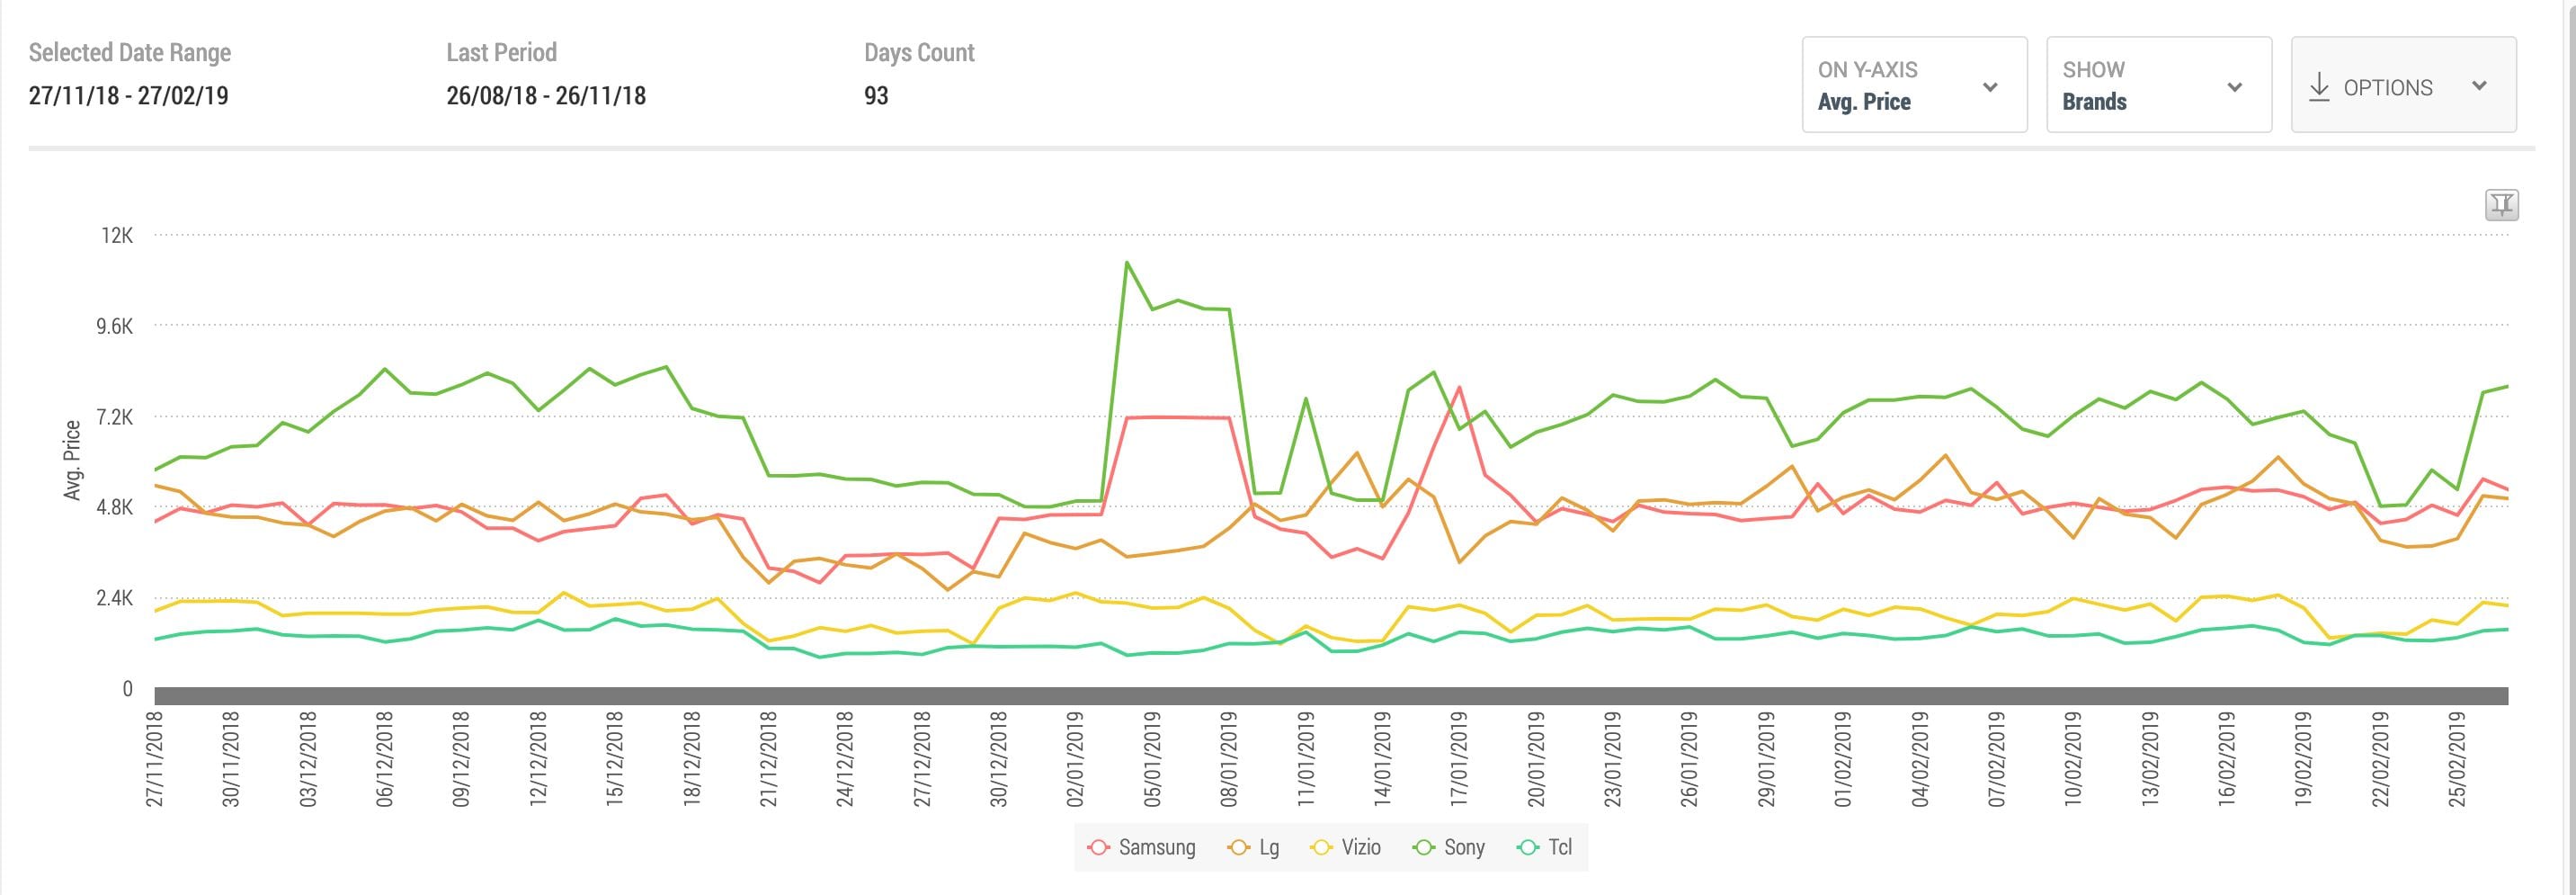
This graph of home entertainment price changes from November to February indicates a positive relationship between high prices and overall fluctuation, with relatively expensive Sony’s prices oscillating considerably and cheaper options VIZIO and TCL fairly stable.
The final word: Deep dive data is crucial to retail success
That’s why Intelligence Node offers technological solutions to give you a leg up on the competition. For instance, the 360°Pricing™ tool gives intelligent insights such as price elasticity and inventory levels for most products in the e-commerce space.
So, while most online resources will tell you the obvious in that digital cameras are on their last leg, our detailed customizable dashboards can tell you that DSLR cameras have the greatest discounts in November while point-and-shoot cameras are cheapest in December. Or, that fans and cooler accessories have experienced the most price fluctuation over the last 3 months.
With Intelligence Node tools at your disposal, you can confidently make data-informed market evaluations in the consumer electronics industry and well beyond.
[“source=electronicdesign”]